
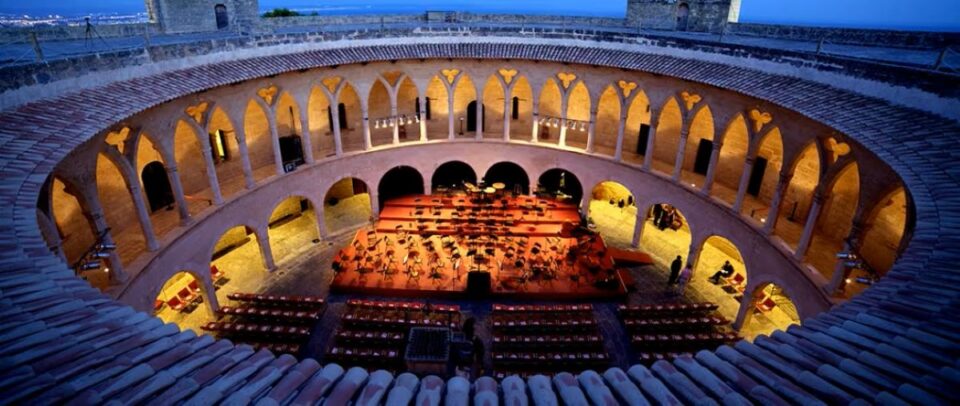
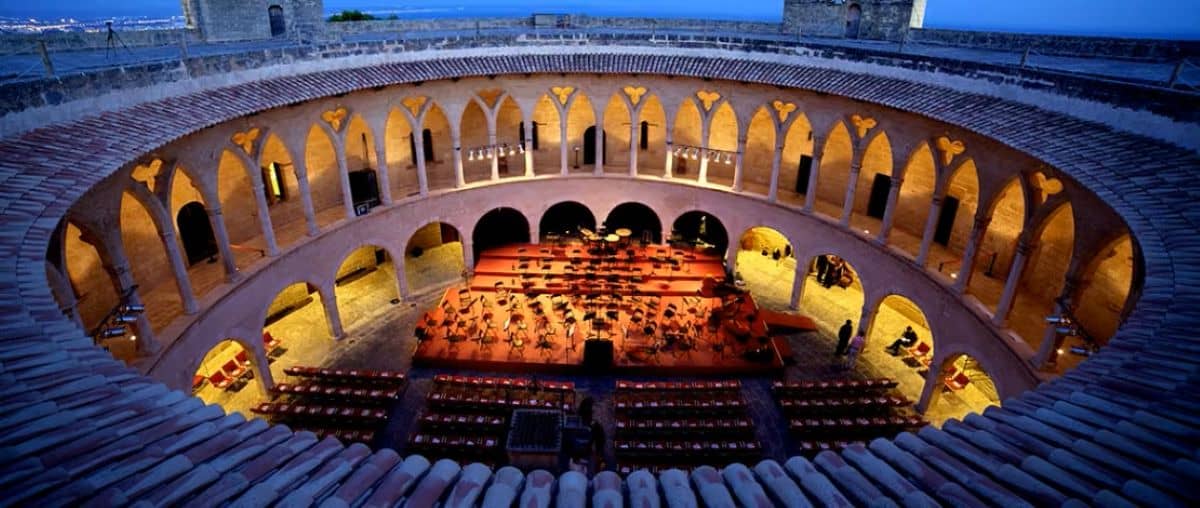
Image Credit- spain.info
Spain’s Shocking Tourism Surge Leaves Netherlands and Belgium Racing to Win Europe’s 2026 Travel Battle.Spain, the Netherlands and Belgium recorded strong tourism growth in 2025, with further expansion expected in 2026. Spain led with 96.8 million international tourists and €134.7 billion in visitor spending, while the Netherlands welcomed 22.3 million international visitors and 52.2 million accommodation guests. Belgium recorded 10.1 million international arrivals and 46.1 million overnight stays. Looking ahead, Spain could attract up to 101 million tourists in 2026, while the Netherlands may reach 23.2 million international visitors and Belgium 10.5 million. These figures highlight different tourism strengths. Spain dominates international arrivals and visitor spending, while the Netherlands and Belgium benefit from cultural tourism, business travel and regional experiences. All three countries are increasingly focusing on higher-value tourism and sustainable growth.
Spain Tourism Dynamics: 2025–2026 Comparative Economic Analysis
Spain solidified its standing as one of the world’s foremost travel destinations across 2025 and 2026, transitioning from sheer arrival volume toward high-yield expenditure and regional dispersal. In 2025, Spain achieved a historic record by welcoming 96.8 million international tourists, generating €134.7 billion in foreign visitor spending and 366.7 million hotel overnight stays. Entering 2026, inbound momentum expanded further, tracking 5.4% higher in visitor volume through late summer (surpassing 70 million arrivals by August) and moving toward an estimated €142–€145 billion in annual tourist spending, sustained by robust shoulder-season travel, higher Average Daily Rates (ADR), and expanding long-haul transatlantic connectivity.
| Indicator / Metric | 2025 Recorded Benchmark | 2026 Projections & Trends |
| International Tourist Arrivals | 96.8 million (Historical record) | ~99.5–101.0 million (+4.6% to +5.4% pace) |
| Total International Expenditure | €134.7 billion (+6.8% YoY) | ~€142.0–€145.0 billion (+7.0% to +7.8% pace) |
| Average Daily Spend per Tourist | €195 / day | ~€202–€211 / day |
| Top Regional Destinations | Catalonia (20.0M), Balearics, Canaries | Balearic Islands, Catalonia, Andalusia |
| Leading Long-Haul Origin Growth | United States (~4.3M+ arrivals) | Americas & East Asian corridor expansion |
Inbound Markets: Who Visits Most and Why?
- Primary Feeder Corridors: The United Kingdom remains Spain’s largest inbound source market, generating over 19 million annual visitors and exceeding €23.7 billion in spending, followed closely by France, Germany, and Italy. The United States continues to serve as the highest-spending long-haul origin, supported by expanding non-stop transatlantic flight routes into Madrid and Barcelona.
- Core Travel Drivers:
- Sun, Coastal & Island Tourism: World-renowned beach hubs across the Balearic Islands (Mallorca, Ibiza), Canary Islands (Tenerife), and Costa del Sol draw massive year-round holidaymakers.
- World-Class Heritage & Metros: Iconic architecture and cultural centers across Barcelona (Sagrada Família), Madrid (Prado Museum, Royal Palace), Seville, and Granada (Alhambra).
- Gastronomy & Lifestyle: Globally celebrated regional cuisine—from Basque pintxos circuits to Andalusian tapas—paired with favorable climate, developed high-speed rail (AVE), and safe travel infrastructure.
Netherlands Tourism Dynamics: 2025–2026 Comparative Economic Analysis
The Netherlands’ visitor economy pivoted across 2025 and 2026 from volume recovery toward value-driven dispersion and destination management. In 2025, the country registered 52.2 million total accommodation guests, supported by 22.3 million international arrivals—a 5% year-on-year increase that offset softening domestic stays. Accommodation stays reached record engagement across hotels and campsites, with Amsterdam capturing 9.5 million visitors. Moving into 2026, inbound demand stabilized near 53 million total guests. Tourism policies and tax adjustments—including accommodation VAT recalibration and strict urban cruise caps—have moderated peak metropolitan crowding in North Holland while accelerating regional dispersal toward Flevoland, Groningen, and Gelderland.
| Indicator / Metric | 2025 Recorded Benchmark | 2026 Projections & Trends |
| Total Overnight Guests | 52.2 million (+1.8% YoY) | ~53.0 million (+0.5% growth) |
| International Visitor Arrivals | 22.3 million (+5.0% YoY) | ~22.8–23.2 million |
| Hotel Overnight Stays | 33.7 million guests (+1.5%) | ~34.0–34.5 million guests |
| Amsterdam Visitor Concentration | 9.5 million guests | Stabilizing under municipal caps |
| Campsite & Holiday Park Stays | 17.0 million guests (+9% camps) | Sustained regional eco-travel growth |
Inbound Markets: Who Visits Most and Why?
- Primary Feeder Corridors: Germany represents the single largest foreign source market (exceeding 3.4 million hotel guests), followed by the United Kingdom, Belgium, and the United States (the primary high-yield long-haul market).
- Core Travel Drivers:
- Art, Museums & Urban Canals: World-class cultural institutions in Amsterdam (Rijksmuseum, Van Gogh Museum), the Hague, and Rotterdam attract dense year-round city-break demand.
- Seasonal Landscapes & Cycling: Global draws for spring tulip blossoms (Keukenhof), UNESCO windmill networks (Kinderdijk), and an extensive 35,000 km national cycling tourism infrastructure.
- High-Speed Connectivity & Business Travel: Superior international rail connections (Eurostar, ICE) and major corporate congress hubs attract high-spending European weekenders and MICE delegates.
This data is covered from Statistics Netherlands (CBS) and the Netherlands Board of Tourism & Conventions (NBTC).
Belgium Tourism Dynamics: 2025–2026 Comparative Economic Analysis
Belgium’s tourism sector consolidated steady post-pandemic expansion across 2025 and 2026, pivoting toward cultural heritage immersion, business tourism, and regional outdoor recreation. In 2025, Belgian tourist accommodations registered an all-time record of 46.1 million overnight stays (a 2.9% year-on-year increase) alongside more than 10.1 million non-resident visitor arrivals. Flanders absorbed 63% of total overnight stays, supported by strong gains in Wallonia (+6.9%) and Brussels-Capital. Moving into 2026, total overnight volume has stabilized near 46.5–47.0 million stays. Demand remains balanced between high-yield corporate MICE activity in Brussels and growing eco-tourism across the Ardennes and Campine camping grounds.This data is covered from Statbel (Statistics Belgium) and Visit Flanders.
| Indicator / Metric | 2025 Recorded Benchmark | 2026 Projections & Trends |
| Total Overnight Stays | 46.1 million (+2.9% YoY) | ~46.5–47.0 million |
| Inbound Visitor Arrivals | 10.1 million arrivals | ~10.3–10.5 million |
| Regional Share (Overnight Stays) | Flanders (63%), Wallonia (21%), Brussels (16%) | Flanders & Wallonia eco-resorts leading |
| Hotel Overnight Stays | ~21.2 million (46% of total stays) | ~21.5 million stays |
| Outdoor & Campsite Lodging | 3.74 million overnight stays (+10.5%) | Sustained regional eco-travel expansion |
Inbound Markets: Who Visits Most and Why?
- Primary Feeder Corridors: The Netherlands and France represent Belgium’s largest inbound source markets due to direct road and rail proximity, followed closely by Germany, the United Kingdom, and the United States (the primary high-yield transatlantic origin).
- Core Travel Drivers:
- Medieval Art & Historic Flemish Cities: High, year-round cultural footfall across Bruges, Ghent, Antwerp, and Leuven for UNESCO belfries, Flemish Master art collections, and canal architecture.
- EU Institutions & Corporate Congresses (MICE): Heavy international business travel into Brussels, anchored by European Union administrative bodies, NATO headquarters, and international trade summits.
- Gastronomy & Nature Corridors: Strong cross-border culinary tourism for Belgian chocolate, waffles, and monastic brewing traditions, paired with hiking and cycling retreats across the forested Walloon Ardennes.
Spain Leads European Tourism Growth as the Netherlands and Belgium Focus on Higher-Value Travel
Spain’s Shocking Tourism Surge Leaves Netherlands and Belgium Racing to Win Europe’s 2026 Travel Battle.Spain, the Netherlands and Belgium are entering a new phase of tourism growth in 2026, but their economic priorities differ. Spain remains the clear leader in international arrivals, with visitor numbers projected to reach 99.5–101 million and tourism spending potentially rising to €145 billion. The Netherlands is focusing on managing visitor pressure in Amsterdam while encouraging travel to regional destinations. Belgium continues to strengthen its position through cultural tourism, international business events and outdoor experiences.
The comparison highlights an important shift in European tourism. Growth is no longer measured only by visitor numbers, but increasingly by tourist spending, regional economic benefits and sustainable destination management. Spain benefits from its strong international appeal, while the Netherlands and Belgium are using connectivity, heritage attractions and regional tourism to diversify demand.
Looking ahead, all three countries could benefit from long-haul travel, year-round tourism and growing demand for authentic experiences. However, rising accommodation costs, overcrowding and infrastructure pressures remain important challenges. The 2026 forecasts suggest that the countries able to balance visitor growth with higher spending and effective destination management will be better positioned to secure lasting economic benefits.
The post Spain’s Shocking Tourism Surge Leaves Netherlands and Belgium Racing to Win Europe’s 2026 Travel Battle appeared first on Travel And Tour World.
